As I mentioned in my first blog post, I would use this blog to transfer over some of my previous projects. Towards the end of last year, I created an interactive web map using JavaScript programming. I created the whole page myself and by scratch. Currently, the data may be a bit out of date, but I feel it is worth discussing the process itself to demonstrate my capabilities. The information that will be visible was last updated around November 2021.
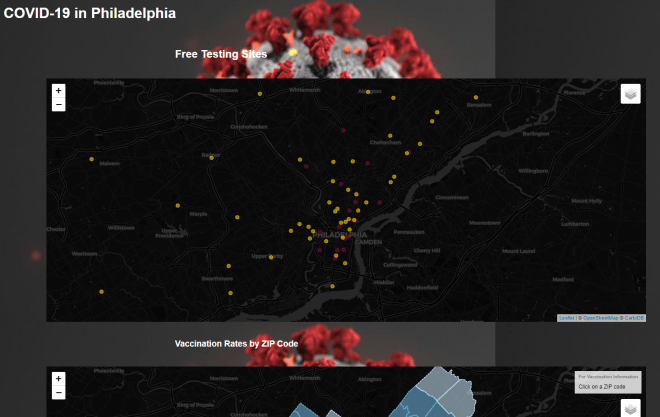
The web map itself hosts 3 different maps, all referring to covid-19 related information; Testing Sites, Vaccination Rates, and Death Rates. Leaflet was utilized and each map itself has a number of interactive elements. That being said, I feel it is best for the maps to be explored themselves, Click here to explore the web maps!
