Analysis of Philadelphia Bicycle Related Car Crashes 2016-2020
Research Objective
Philadelphia implemented its traffic city plan, Vision Zero, in 2016. Annual reports are released every year, but in reviewing the most recent release, there is a lack of GIS visualizations and maps regarding car accidents that involve bicycles. Vision Zero does thoroughly discuss bicycle related topics, such as bicycle lanes; it is felt that the annual reports could provide more spatial context for Philadelphia’s large bicycle community. That being said, the goal of this GIS analysis serves to answer an overarching question, where are bicycle related car crashes occurring in Philadelphia? This spatial analysis will provide context for reference towards this question. First, the bicycle related car crashes in question will be located and displayed, along with distinguishing between severe injury and fatality. Secondly, this analysis will attempt to find the street segments where these bicycle related accidents are occurring, and where they are occurring more frequently. Lastly, for an additional visualization and attempt to give spatial reference, this report will provide context to which intersections bicycle related car crashes are occurring more frequently.
Data
The data used in this analysis are collected from multiple sources. Pennsylvania car crashes were collected through the Pennsylvania Department of Transportation’s (PennDOT) public crash databases (https://crashinfo.penndot.gov/). Philadelphia specific data were gathered through the City of Philadelphia’s open source data repository, OpenDataPhilly (https://www.opendataphilly.org/). Streets segments and intersections were provided through the Philadelphia Streets Department.
Methodology
First, five years (2016-2020) of Pennsylvania car crash data were gathered to ensure a large enough sample to analyze crash patterns. The Pennsylvania car crashes were loaded in through ArcGIS and then selected out to only include car crashes that occurred within Philadelphia County. These car crashes were further filtered to only display those that involved at least one bicycle. These bicycle related crashes (BRCs) were then symbolized on whether the BRC resulted in a bicyclist suffering a severe injury, or resulted in a bicyclist fatality.
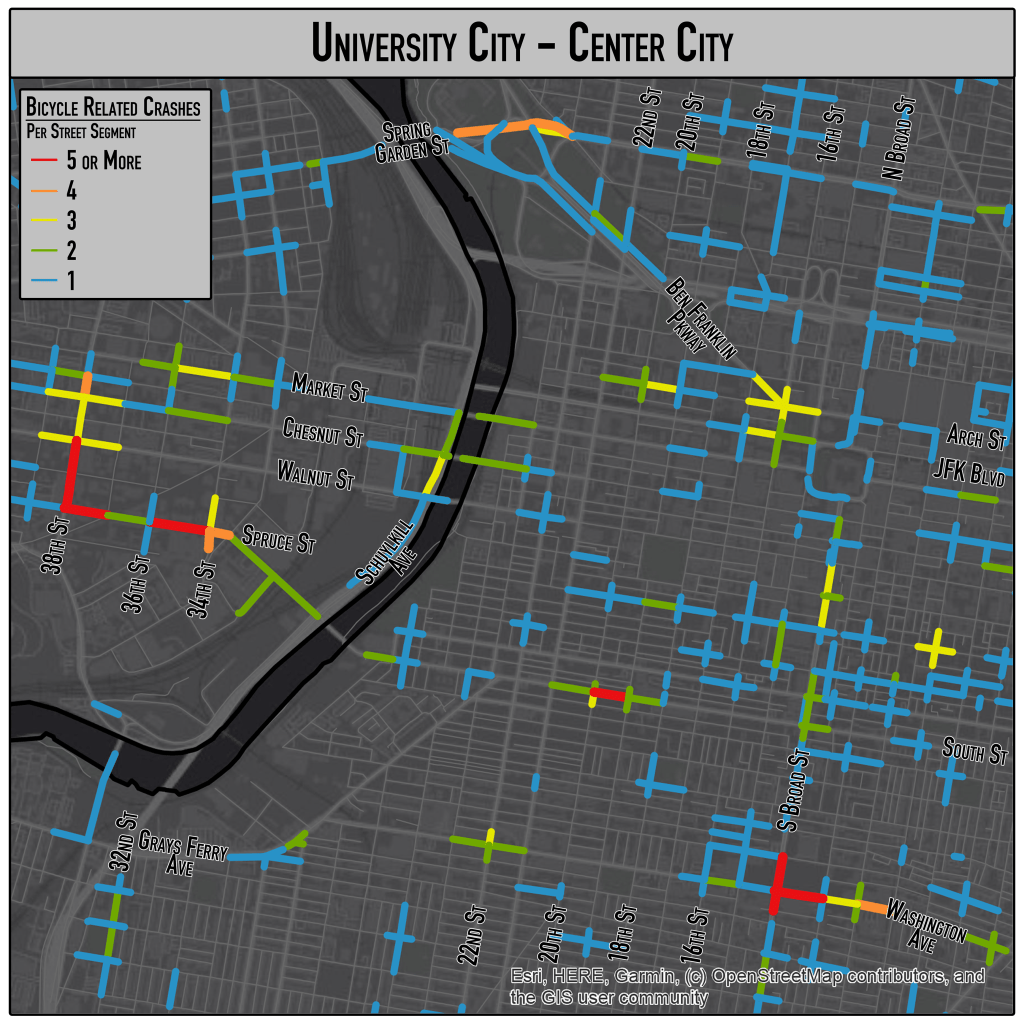
Secondly, the BRCs are explored via their relationship with street segments. The analysis will count the number of bicycle related crashes within a 30 foot radius of each street segment. This length of radius was decided because of the varying range of Philadelphia’s streets. This search radius is large enough to cover all crashes occurring within the city’s larger streets such as Broad St, Washington Ave, or Girard Ave, but not too large to double count many crashes with the city’s street segments that are smaller in width. This decision allows the analysis to count a 60 foot span for each segment. Once the BRCs have been counted by street segment, they are symbolized to allow an accurate visualization of where BRCs are occurring the most.
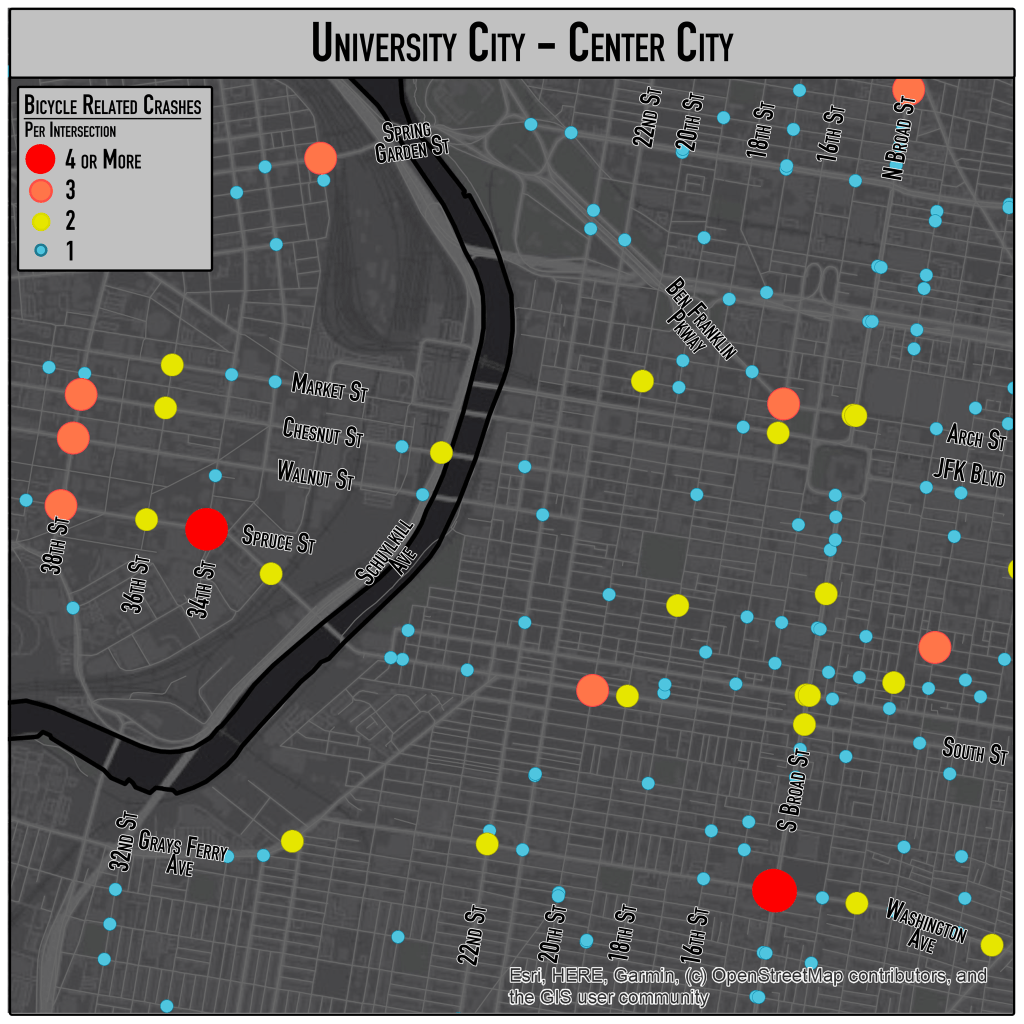
Next, an approach similar to that of the street segments was used, but this time with the city’s streets intersections. However, this portion of analysis counted the number of BRCs within a 60 foot radius. This search radius allows for coverage of Philadelphia’s larger street intersections along with the incoming and outgoing of each intersection. This was decided to be the radius of choice as car accidents could be an effect of the intersection but occur beyond the intersection itself. The BRCs are counted per intersection and then symbolized accordingly to accurately visualize where they are occurring more frequently.
Results
Between 2016 and 2020, there were 27,135 total car crashes in Philadelphia County. Out of those car crashes, 993 involved at least one bicycle. That is, nearly 4% of all car crashes in Philadelphia during this time period involved at least one bicycle. Of the 993 bicycle related car crashes, there were 5 bicyclist fatalities and 27 bicyclists that resulted in suspected serious injury. That being said, 31 crashes resulting in fatality or suspected serious injury of the involved bicyclist amounts to about 4% of the total bicycle related car crashes.
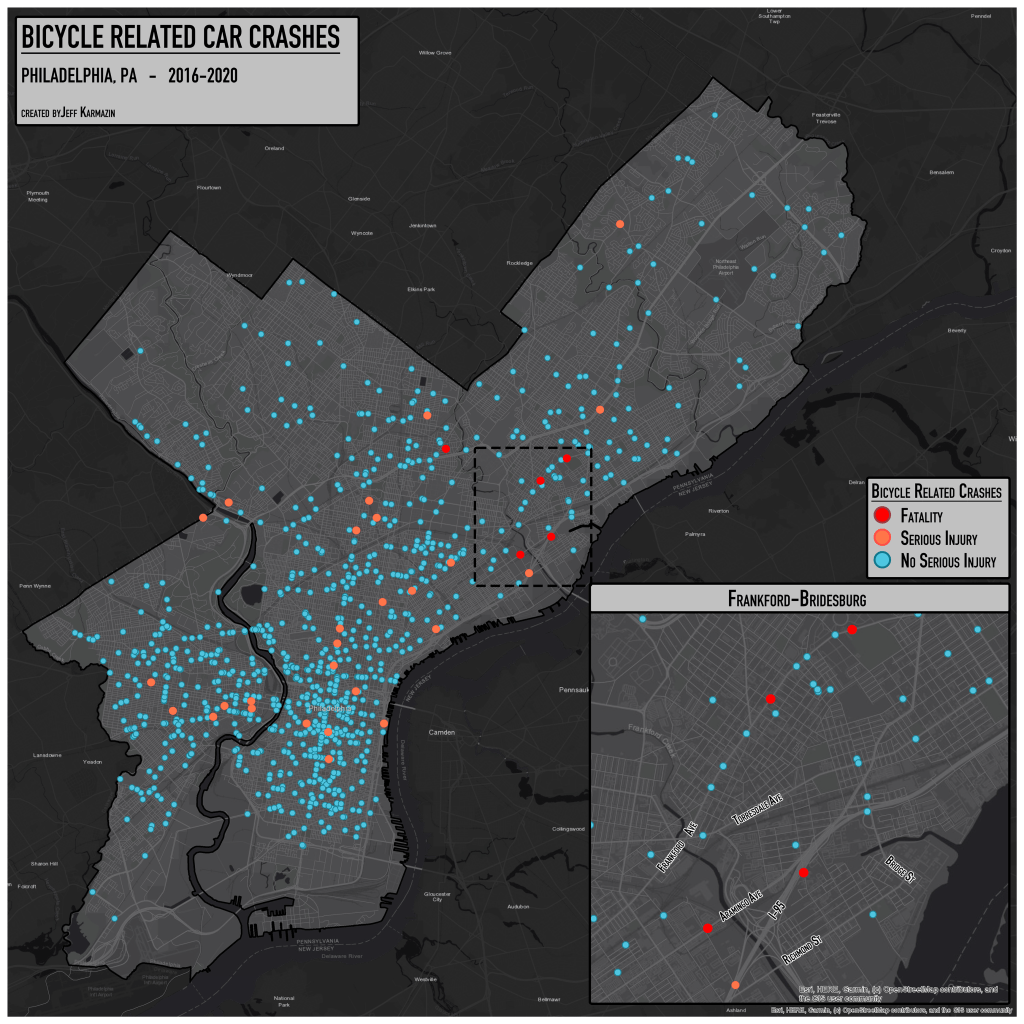
None of the fatalities occurred near any of the hotspots that will be discussed later on. Rather, they all occurred towards the North and Northeast of the city. Two fatalities took place on Frankford Ave, two nearby Aramingo Ave, and the last on C Street which is right off of Rising Sun Ave (not displayed in inset map).
Of the 993 bicycle related car crashes, there were 2021 street segments that had at least one crash occur within 30 feet of its centerline. The street segments with number of crashes were the following:
- 1 bicycle related crash – 1750 street segments
- 2 bicycle related crashes – 217 street segments
- 3 bicycle related crashes – 39 street segments
- 4 bicycle related crashes – 7 street segments
- 5 or more bicycles related crashes – 8 street segments
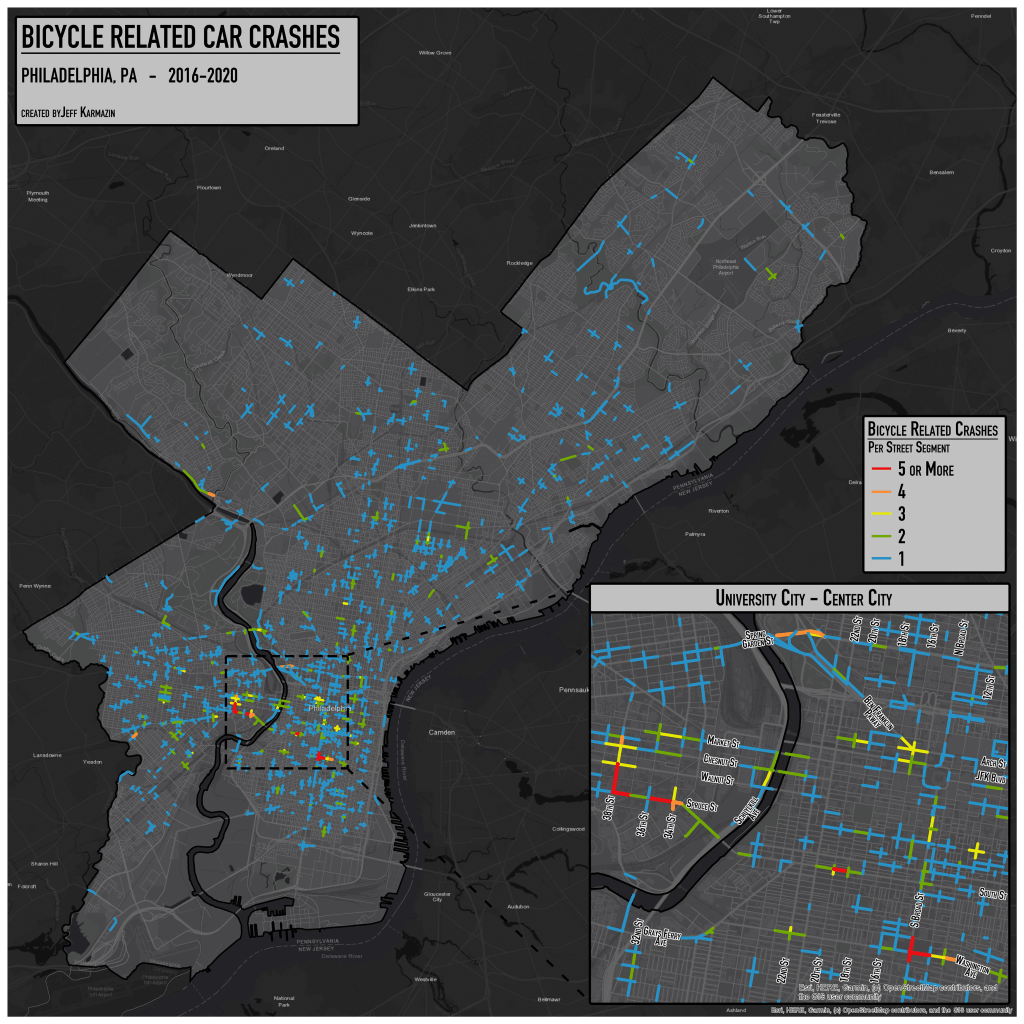
A number of bicycle-involved crash hotspots were identified through this process. The street segments with the highest amount of bicycle related crashes were as follows:
- 3400 Spruce St – 8 bicycle related crashes
- 1300 Washington Ave – 7 bicycle related crashes
- 200-300 S 38th St – 6 bicycle related crashes
There were 4 other street segments with 5 bicycle related crashes:
- 1900 South St
- 900-1099 S Broad St
- 1100 S Broad St
- 3600-3799 Spruce St
There were 664 intersections in the city of Philadelphia that contained at least 1 BRC within 60 feet of its center point. The intersections with number of crashes were as follows:
- 1 bicycle related crash – 594 intersections
- 2 bicycle related crashes – 57 intersections
- 3 bicycle related crashes – 10 intersections
- 4 bicycle related crashes – 0 intersections
- 5 bicycle related crashes – 2 intersections

Similar to the street segments, there were a number of hot spots where there were a higher number of intersection BRCs occurring. Both of the following contained 5 bicycle related crashes:
- S Broad St & Washington Ave
- S 34th St & Spruce St
Conclusion
Locating BRCs by street segments and intersections have revealed a number of hotspots. The Two hotspots that stand out the most are at Broad & Washington and 34th & Spruce. A closer look at these two intersections will hopefully reveal similarities between the two. Perhaps, if similarities are seen, it can be used for an explanation as to why these two locations are a hotspot for BRCs. In identifying this, the city can further plan in the future on how to avoid many significant bicycle related car crashes in areas such as these.
