JavaScript for Interactive Web Maps
Utilizing JavaScript and Leaflet, I created a web page that hosts three interactive web maps. This was a part of a project from the Web Mapping course I was taking at Temple University. The information is related to Covid-19 in Philadelphia. Data was current as of November 2021.
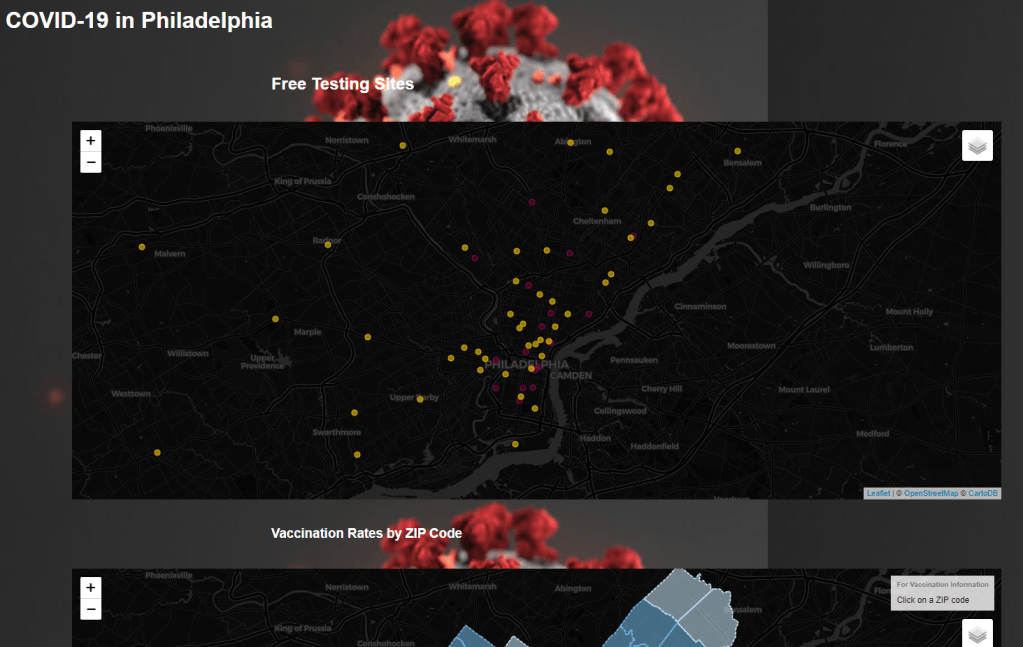
The first map shows free Covid-19 testing sites throughout Philadelphia. Clicking a point will display information specific to it’s locations such as address, whether the testing is drive-up or walk-up, and a link to it’s website.
The second map displays vaccination rates by zip codes. It contains two layers for the map, fully vaccinated rates and partially vaccinated rates. Click a zip code to display more information. Each map displays a number of interactive elements.
The final map shows Covid-19 related deaths by zip codes. Again here, click a zip code to display information regarding the totals.
I feel it is best for these maps to be explored themselves to see the features they contain. Please click here to explore the web maps!